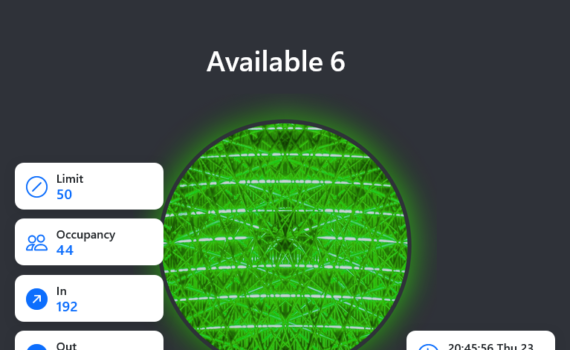
We offer several dashboards that update automatically. We can customise the dashboards to fit the metrics that you wish to display. We can also add your logo and text. This dashboard has a series of cards that show the entrance counts, the building occupancy, the occupancy limit and the number […]
Reporting
8 posts
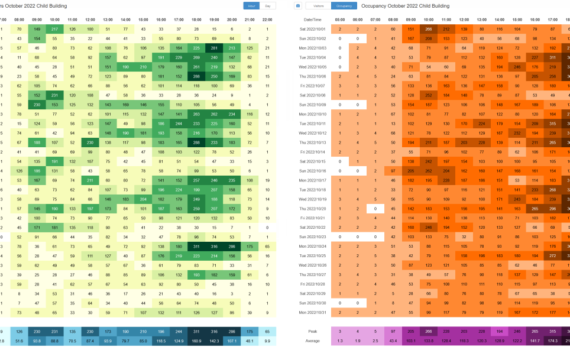
The latest update to our web reporting and emailed reports contains several new features. These are changes that have been requested by customers and are important improvements. You can view all the upgrades in our demo reporting service. Visitor and Occupancy Density We’ve added the ability to view both visitor […]

Our HTML5 web reporting now includes a dashboard for visitor counting. The elements on the dashboard will automatically update, so it is ideal for displays that wish to show fixed metrics. The dashboard can update in real-time if the sensors support this feature. To see the dashboard in action, login […]

Xenometric’s web reporting product now has full documentation. This manual describes how to use the web reporting and is available as a PDF or can be viewed online. The documentation is also available in the web reporting product. Click the help icon at the top-right of the page to launch […]

What is Access Control? Access Control is defined as the mechanism of limiting access to a location based on permissions. This has been a staple of the security industry for many years. Traditionally, physical barriers and an identification mechanism, such as a magnetic card reader, would restrict access to authorised […]

All of your data can now be easily downloaded from within the web reporting software. The Hourly Data button provides a simple way of downloading your data in CSV format. CSV data files can be opened in Excel and all other spreadsheet applications. Within the Advanced Options form, you can […]

Click on the PDF Report button on your Visitor report and the Xenometric Web Reporting will download a PDF to your device. The PDF will contain the visitor chart and table. Your logo can be added to the title and footer of PDF for a professional look. The table shows […]
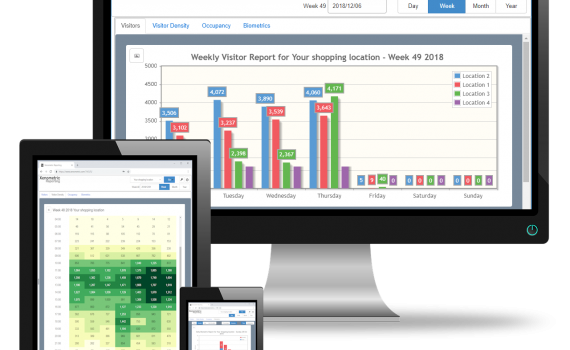
View a demo of our reporting at http://www.xenometric.com:7443/?user=demo&pass=demo. This software can be installed on a customer’s server or you can use our cloud platform.