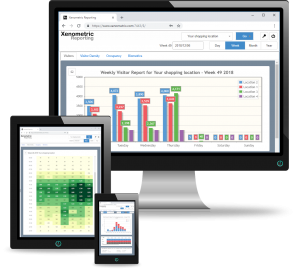
Visitor reports allow you to analyse the pedestrian traffic that arrives in your property or properties. Data can be displayed by entrance, zone within a building, across the whole building, or aggregated over a collection of buildings. You can view your counts for each hour of the day, week of the year, days of the month, months of the year or a custom range. You can also compare the current period with the previous week, month or year.
Occupancy and Dwell Time
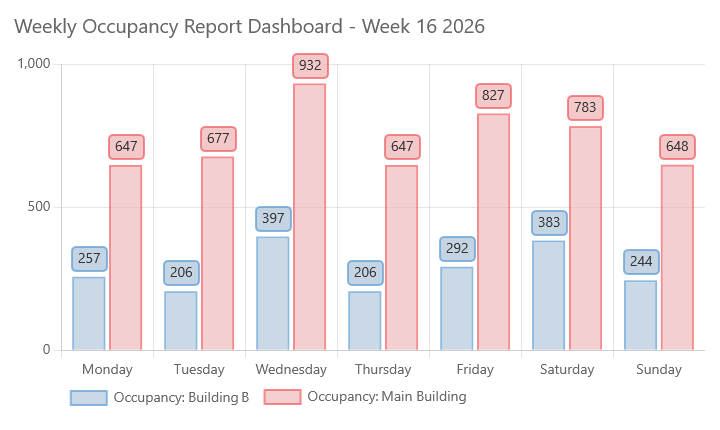
Occupancy is the number of people within an area at a given time. Dwell time is the average amount of time that people reside within an area. To measure occupancy and dwell time, the area’s entries and exits must be monitored by people counters. These two metrics are much harder to deliver than standard pedestrian flow statistics. This is due to small inaccuracies in people counting leading to large errors in the occupancy and dwell time calculations. This is explained in more detail in our article about occupancy. 🔗
Dashbaords
We offer several dashboards that update automatically. We can customise the dashboards to fit the metrics that you wish to display. We can also add you logo and text.
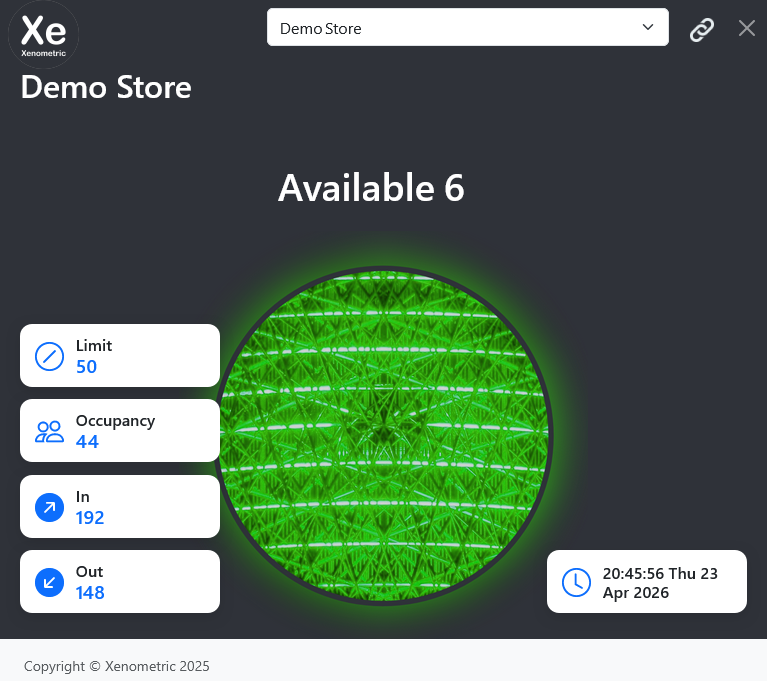
This dashboard shows a traffic light image that changes according to the current occupancy and the occupancy limit. When the occupancy exceeds the limit, the traffic light will turn red.
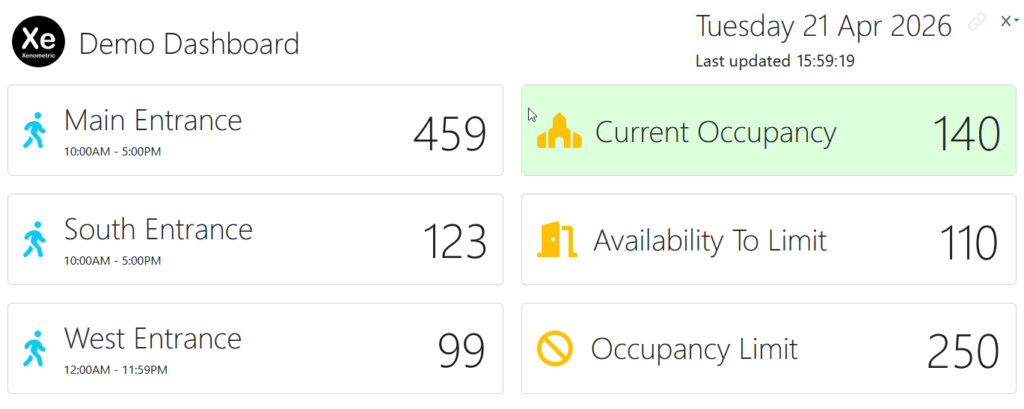
This dashboard has a series of cards that show the entrance counts, the building occupancy, the occupancy limit and the number of visitors that can enter before the limit is reached.
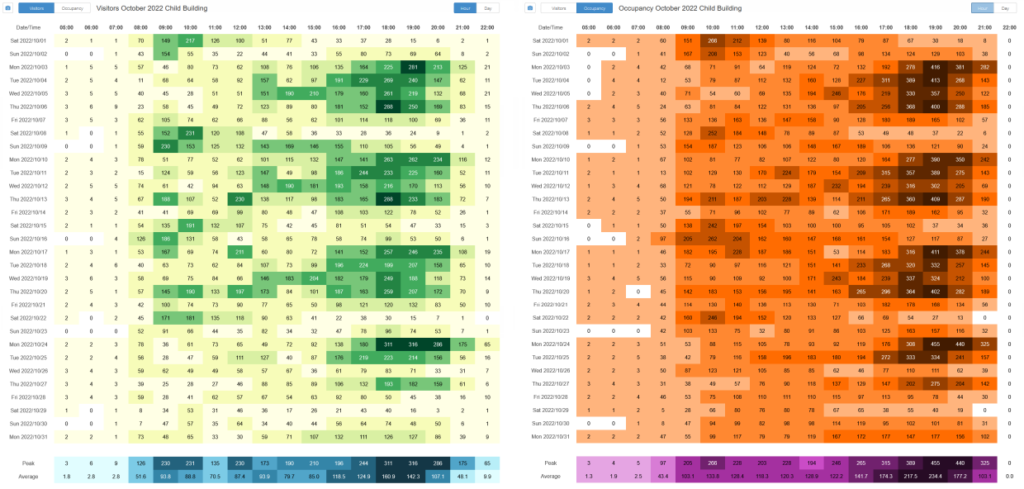
Time Density
The Time Density graphic allows you to see at a glance when the busy and quiet times occur at your locations. the graphic can show each hour of the week, each day of the month, or each day of the year. The location can be chosen as a specific entrance, an area within a building, the whole building or a collection of building.
Secure
Xenometric’s web reporting can run from within your private network, so no external parties can access the data or reporting software. If you use Xenometric’s Cloud Reporting, the connection is secured by SSL and will be encrypted between your computer and the Xenometric server.
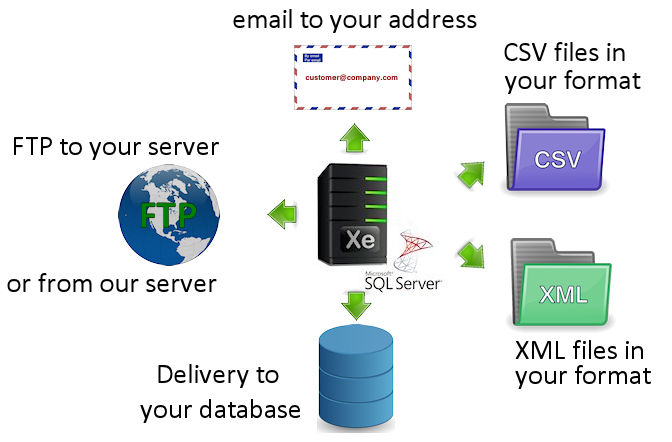
Export and integration
At the heart of Xenometric’s software is an instance of Microsoft’s SQL Server. Customers can access this database directly, or we can output your data in a suitable file format (CSV, XML etc.). We can also provide emailed reports (PDF and CSV attachments) and file delivery by FTP. If you have have your own SQL Server, we can install our database into your SQL Server instance.
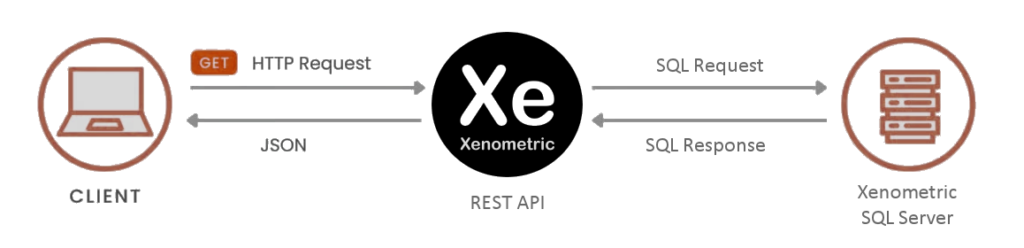
REST API
Xenometric’s REST API allows customers to request data from our database, without the need to connect directly to the database. This provides a safe and standard way for customers to access their data with technology that they may already employ.
We use cookies to ensure that we give you the best experience on our website. If you continue to use this site we will assume that you are happy with it.