

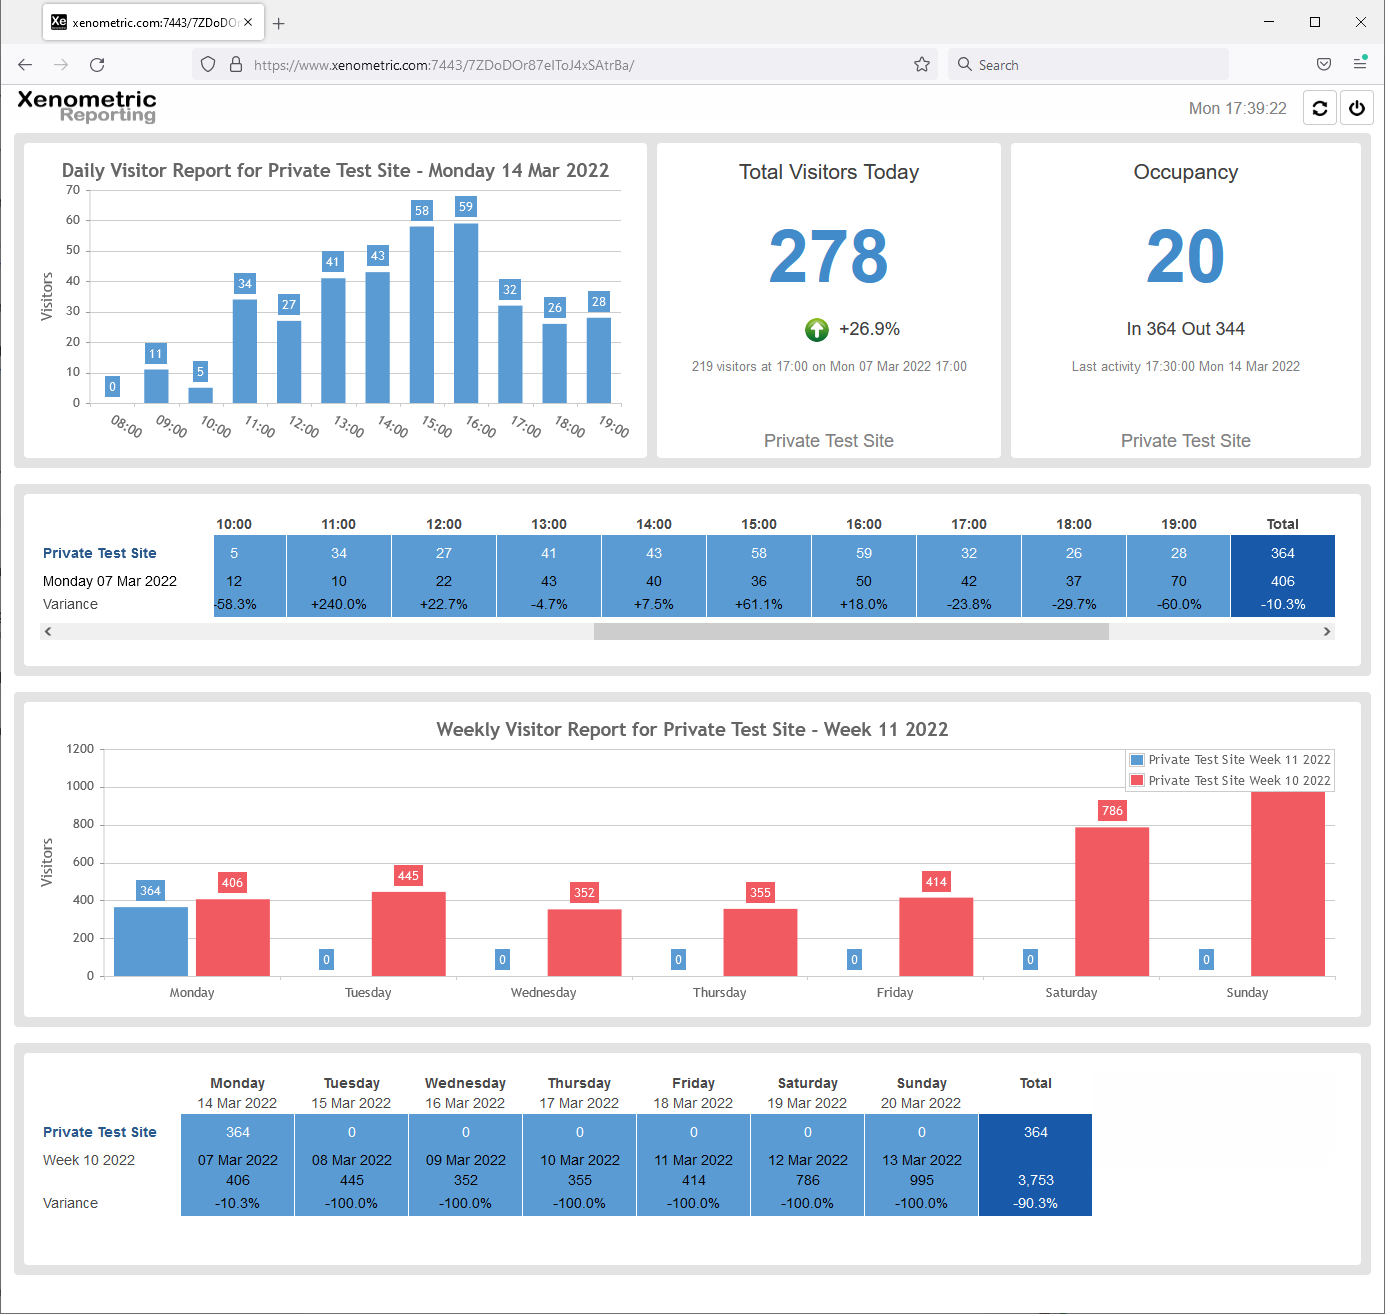
Our HTML5 web reporting now includes a dashboard for visitor counting. The elements on the dashboard will automatically update, so it is […]
Xenometric’s web reporting product now has full documentation. This manual describes how to use the web reporting and is available as a […]
View a demo of our reporting at http://www.xenometric.com:7443/?user=demo&pass=demo. This software can be installed on a customer’s server or you can use our cloud […]
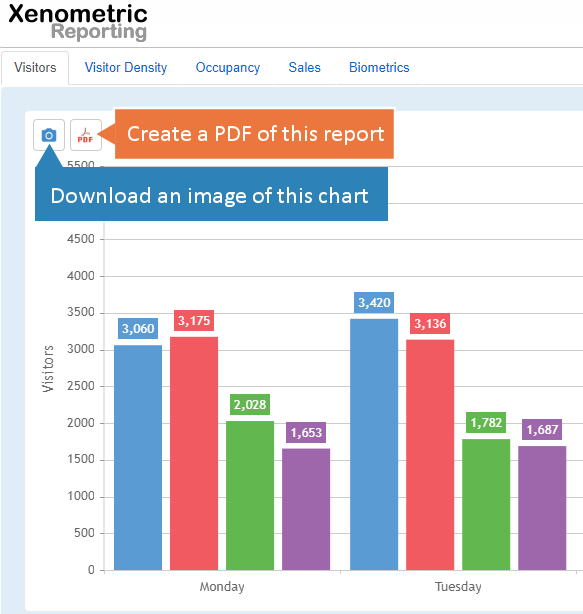
The latest update to our web reporting and emailed reports contains several new features. These are changes that have been requested by […]


