People Counting - Visitors
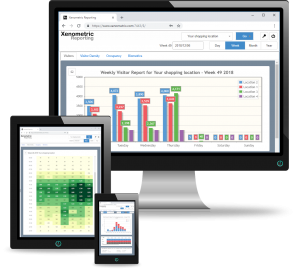
Visitor reports allow you to analyse the pedestrian traffic that arrives in your property or properties. Data can be displayed by entrance, zone within a building, across the whole building, or aggregated over a collection of buildings. You can view your counts for each hour of the day, week of the year, days of the month, months of the year or a custom range. You can also compare the current period with the previous week, month or year.
Time Density
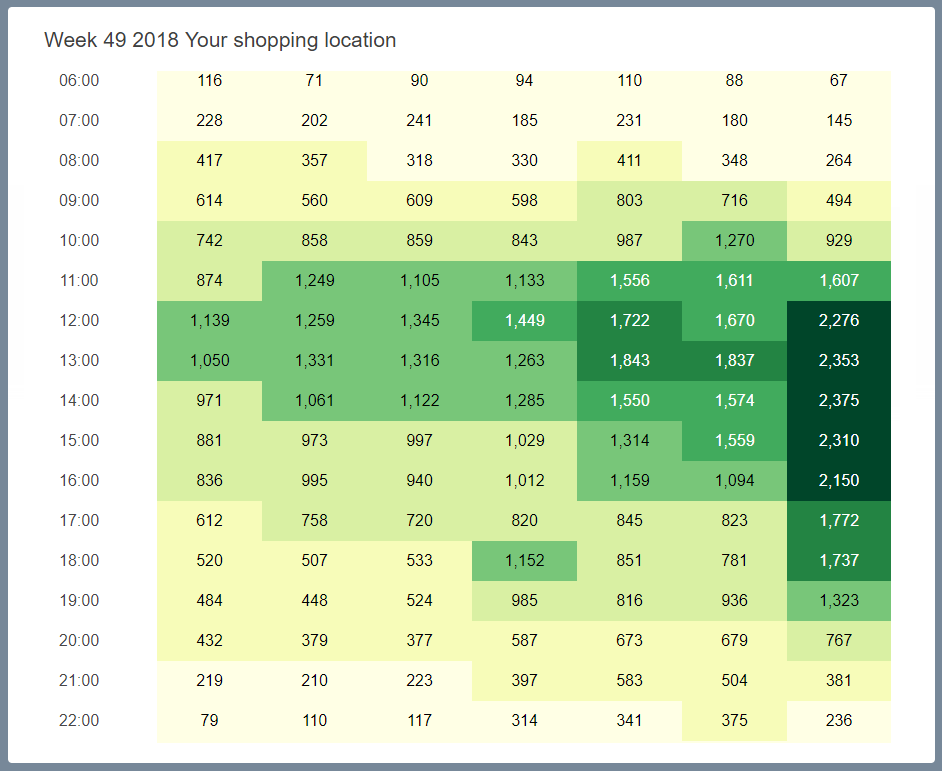
The Time Density graphic allows you to see at a glance when the busy and quiet times occur at your locations. the graphic can show each hour of the week, each day of the month, or each day of the year. The location can be chosen as a specific entrance, an area within a building, the whole building or a collection of building.
Point of Sale (POS)
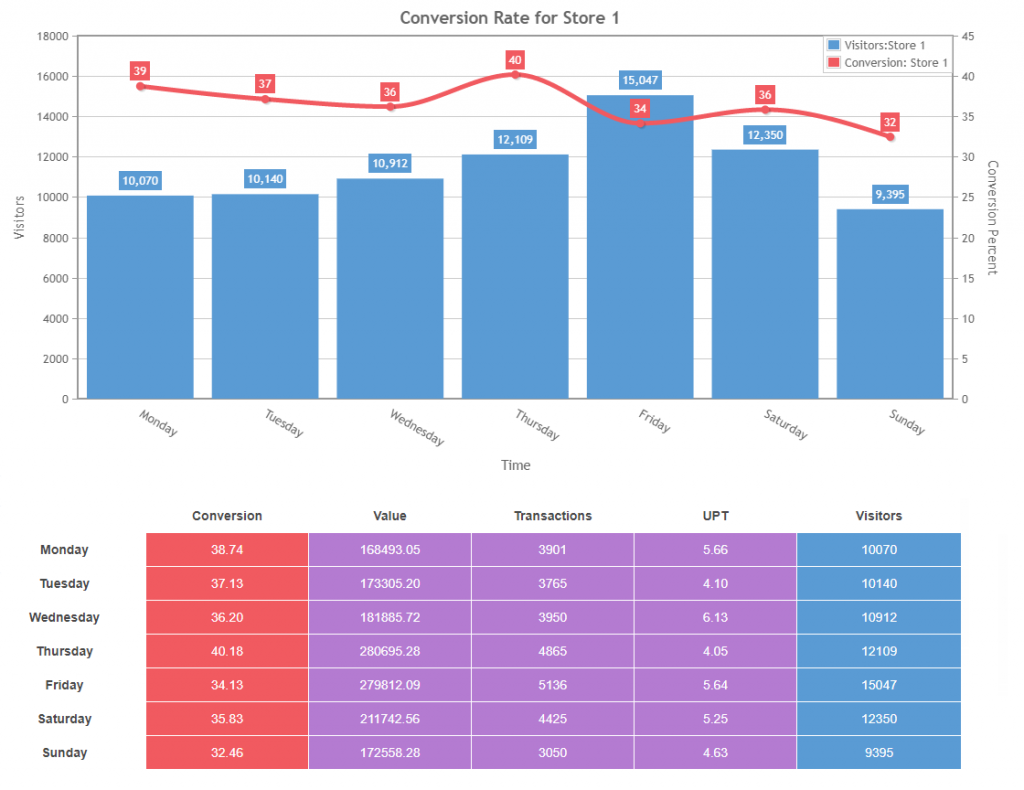
Xenometric can collect your POS data and display it with your people-counting data. Conversion rate is the percentage of visitors that made a purchase and is a key metric for retailers. Our reports can show the conversion rate, sales value, transaction count and units per transaction.
Occupancy and Dwell Time

Secure
Xenometric’s web reporting can run from within your private network, so no external parties can access the data or reporting software. If you use Xenometric’s Cloud Reporting, the connection is secured by SSL and will be encrypted between your computer and the Xenometric server.
Export and integration
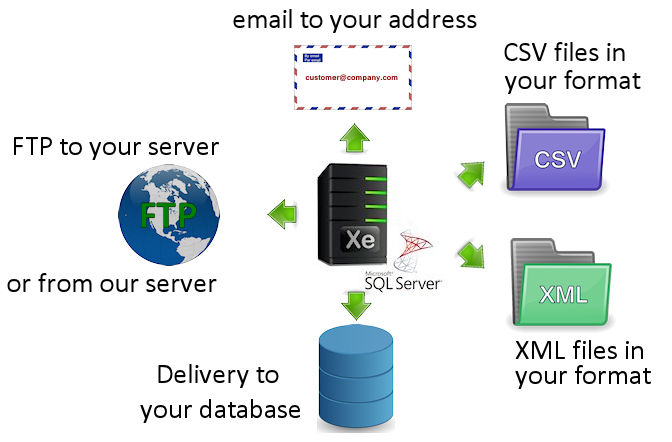
At the heart of Xenometric’s software is an instance of Microsoft’s SQL Server. Customers can access this database directly, or we can output your data in a suitable file format (CSV, XML etc.). We can also provide emailed reports (PDF and CSV attachments) and file delivery by FTP. If you have have your own SQL Server, we can install our database into your SQL Server instance.
Biometrics
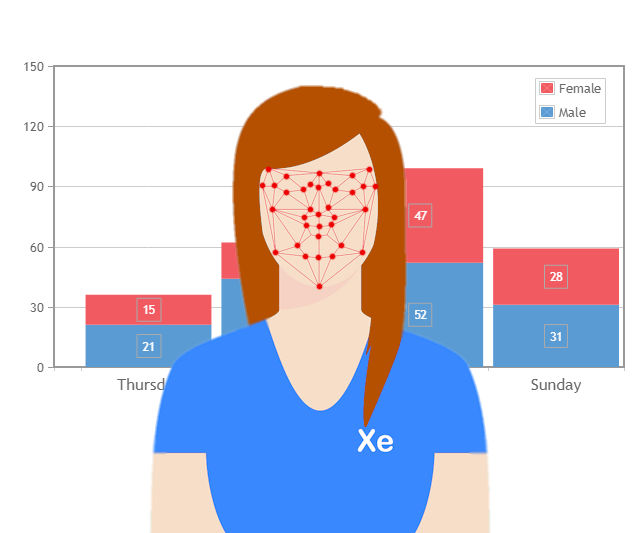
Xenometric can collect data from Cognitec systems and create web reports based on the recorded biometric data. We can show breakdowns of visitors by age and gender.

